Graph Gallery
Real screenshots of the live app — one graph, six views, five lenses, three personas.
HoneyMoney isn't a ledger with charts bolted on. A household's money is modelled as a knowledge graph — income → buckets → spend → goals — and the same graph re-renders six ways, filters through any lens, and serves one person, a couple and a whole family with zero schema changes.
Six views of the same graph
The view switcher re-projects the identical underlying graph. Each view answers a different question.
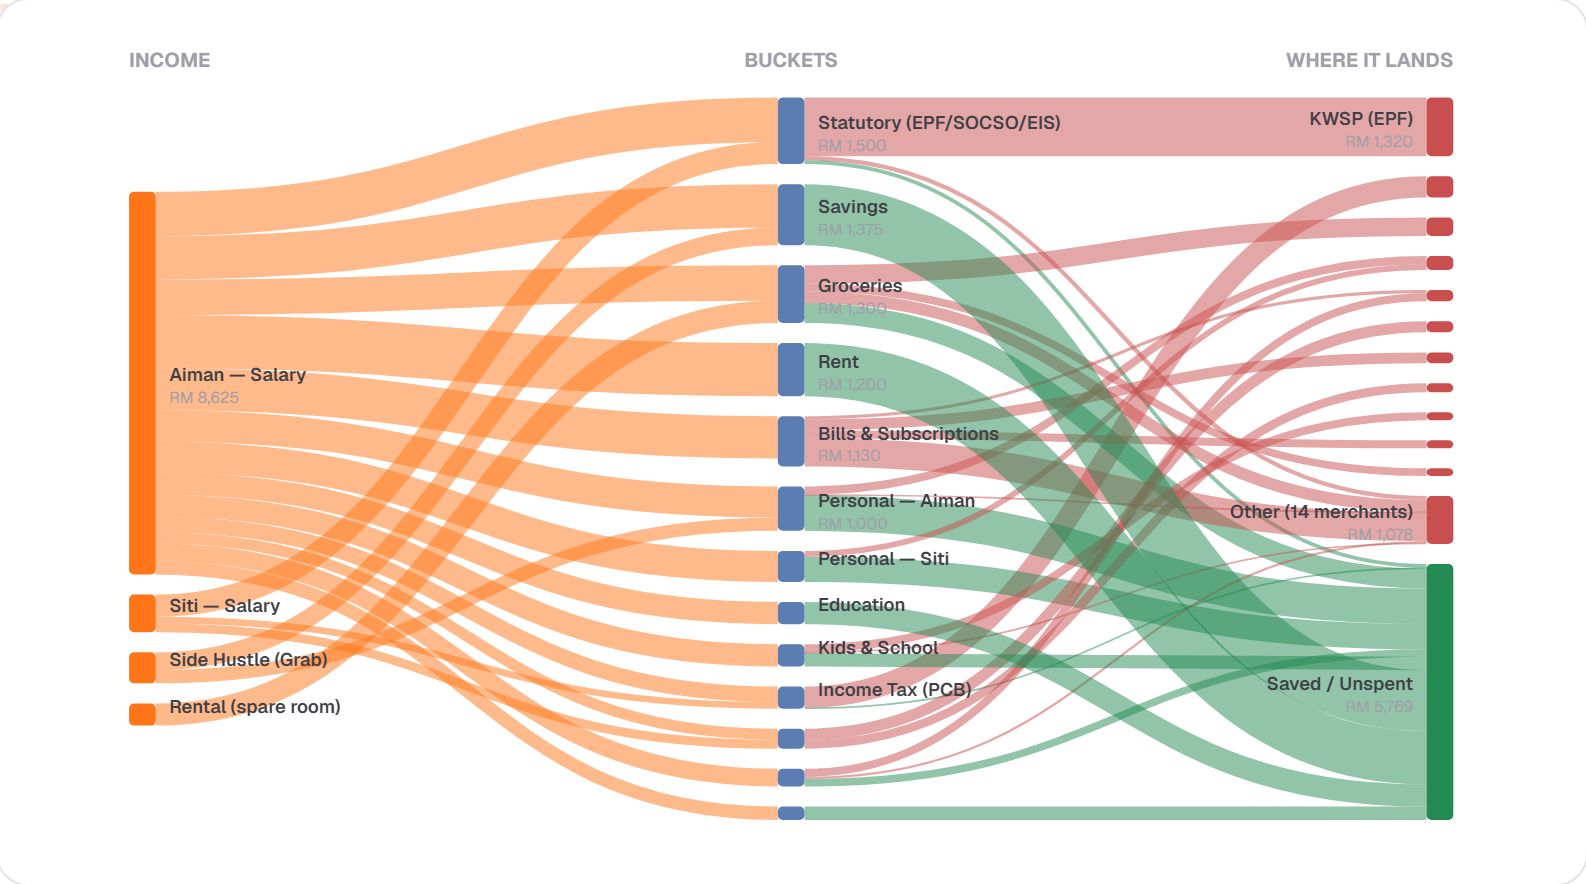
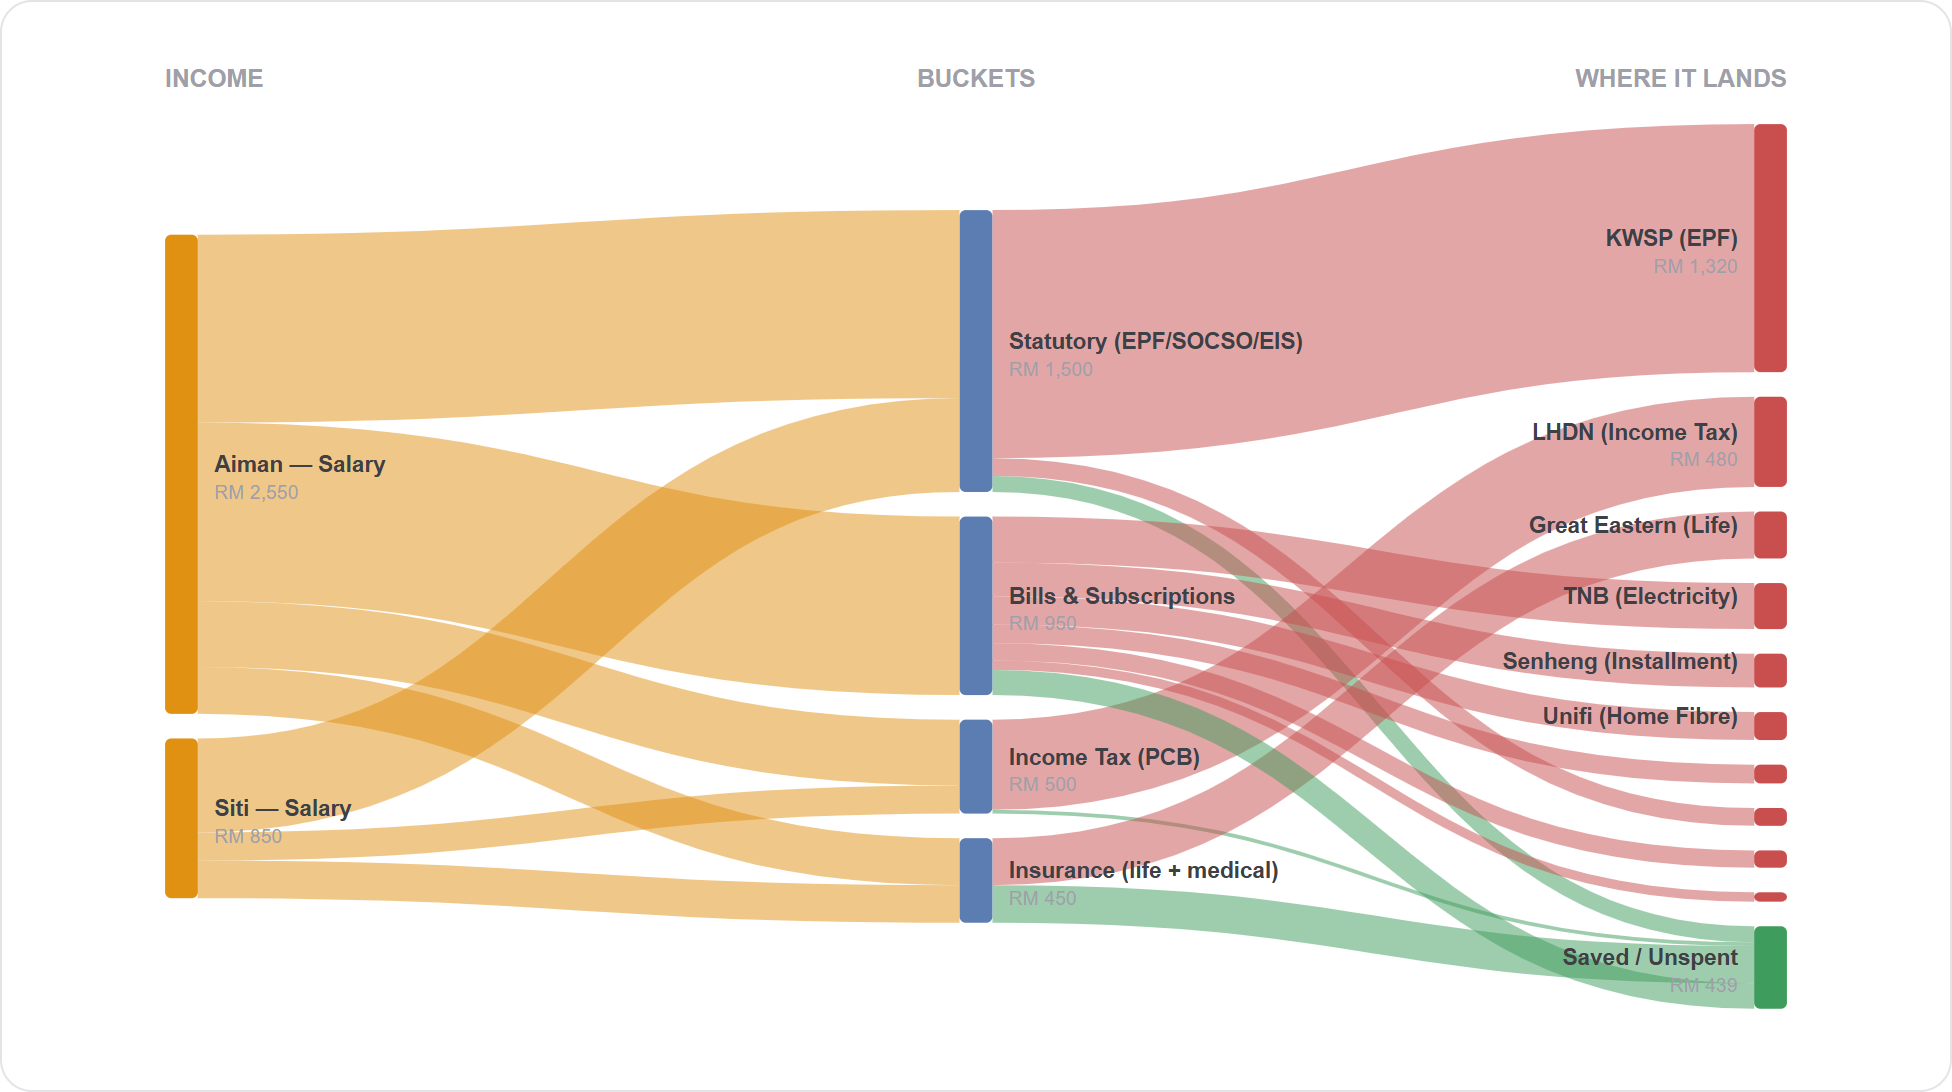
Sankey — where does every ringgit go?
Income (left) splits into buckets (middle), then into real spending (red) versus what stays Saved / Unspent (green). Ribbon width ∝ RM — the money-flow story in one glance, and the exact structure Honey reasons over.
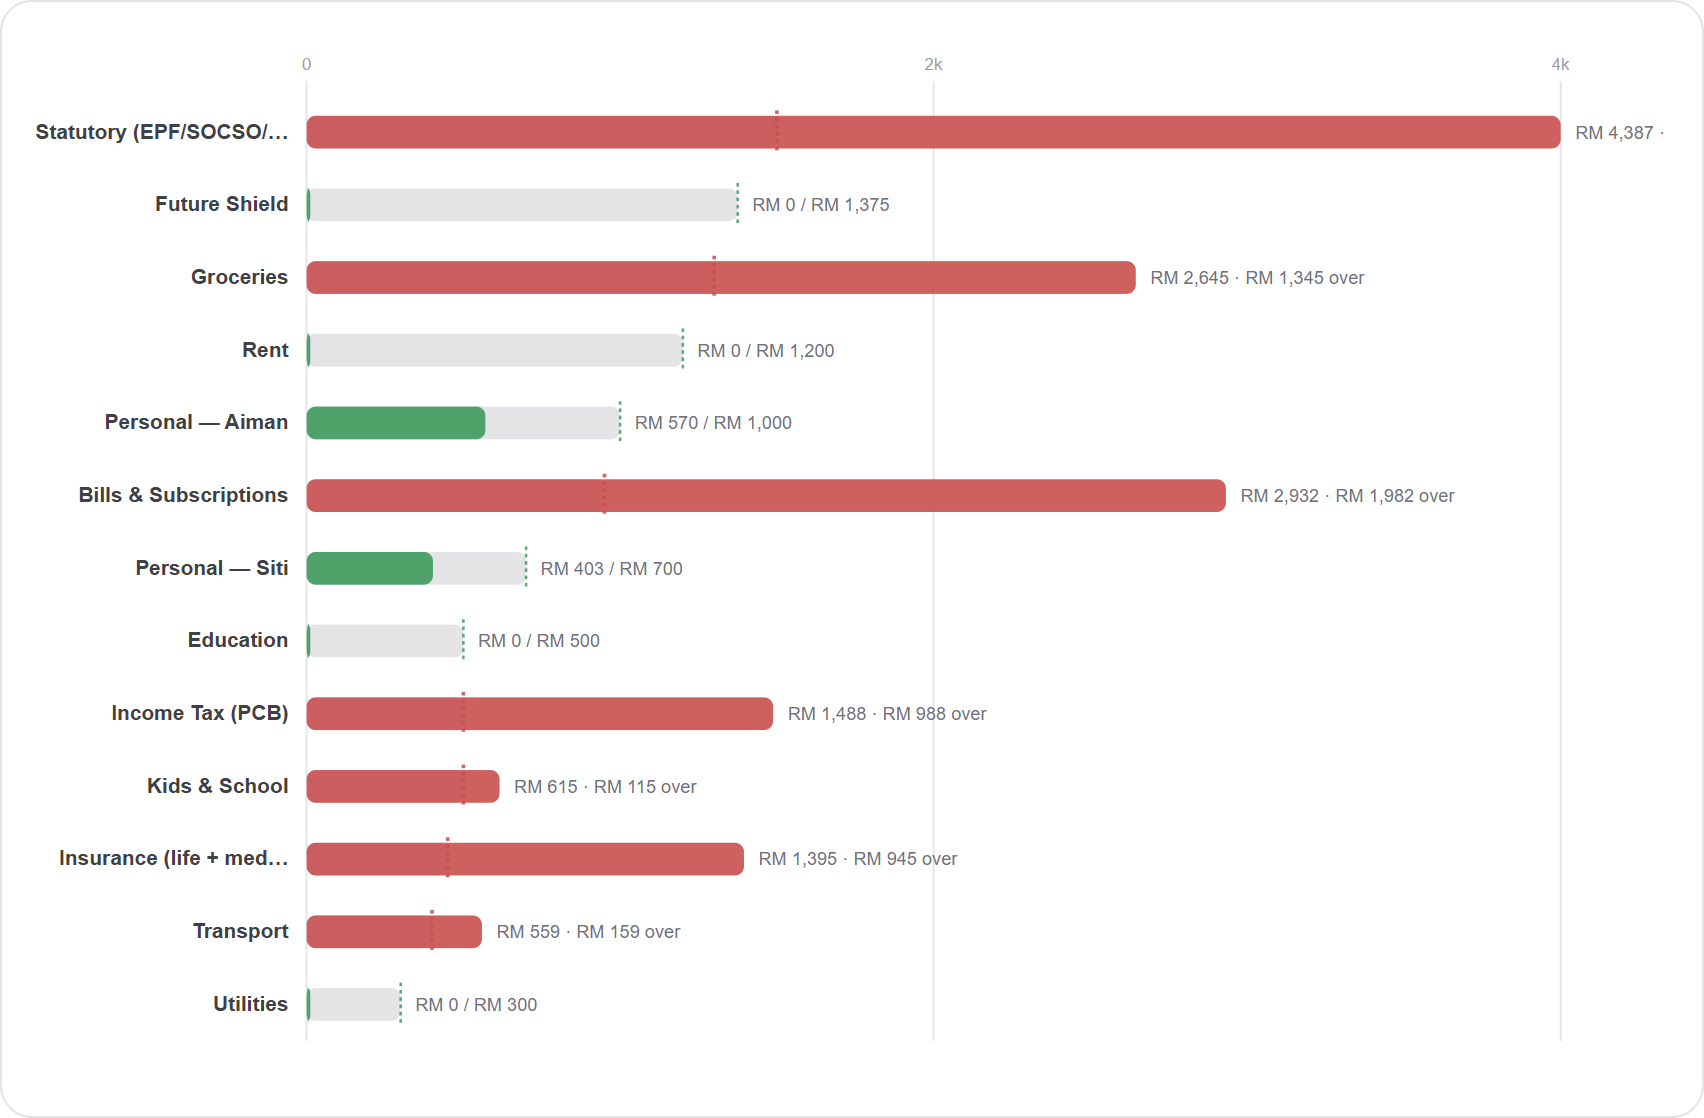
Budget — budget vs actual, directly comparable
Every bucket on one shared RM scale; the dashed line is the allocation cap. Red bars are the ones bleeding.
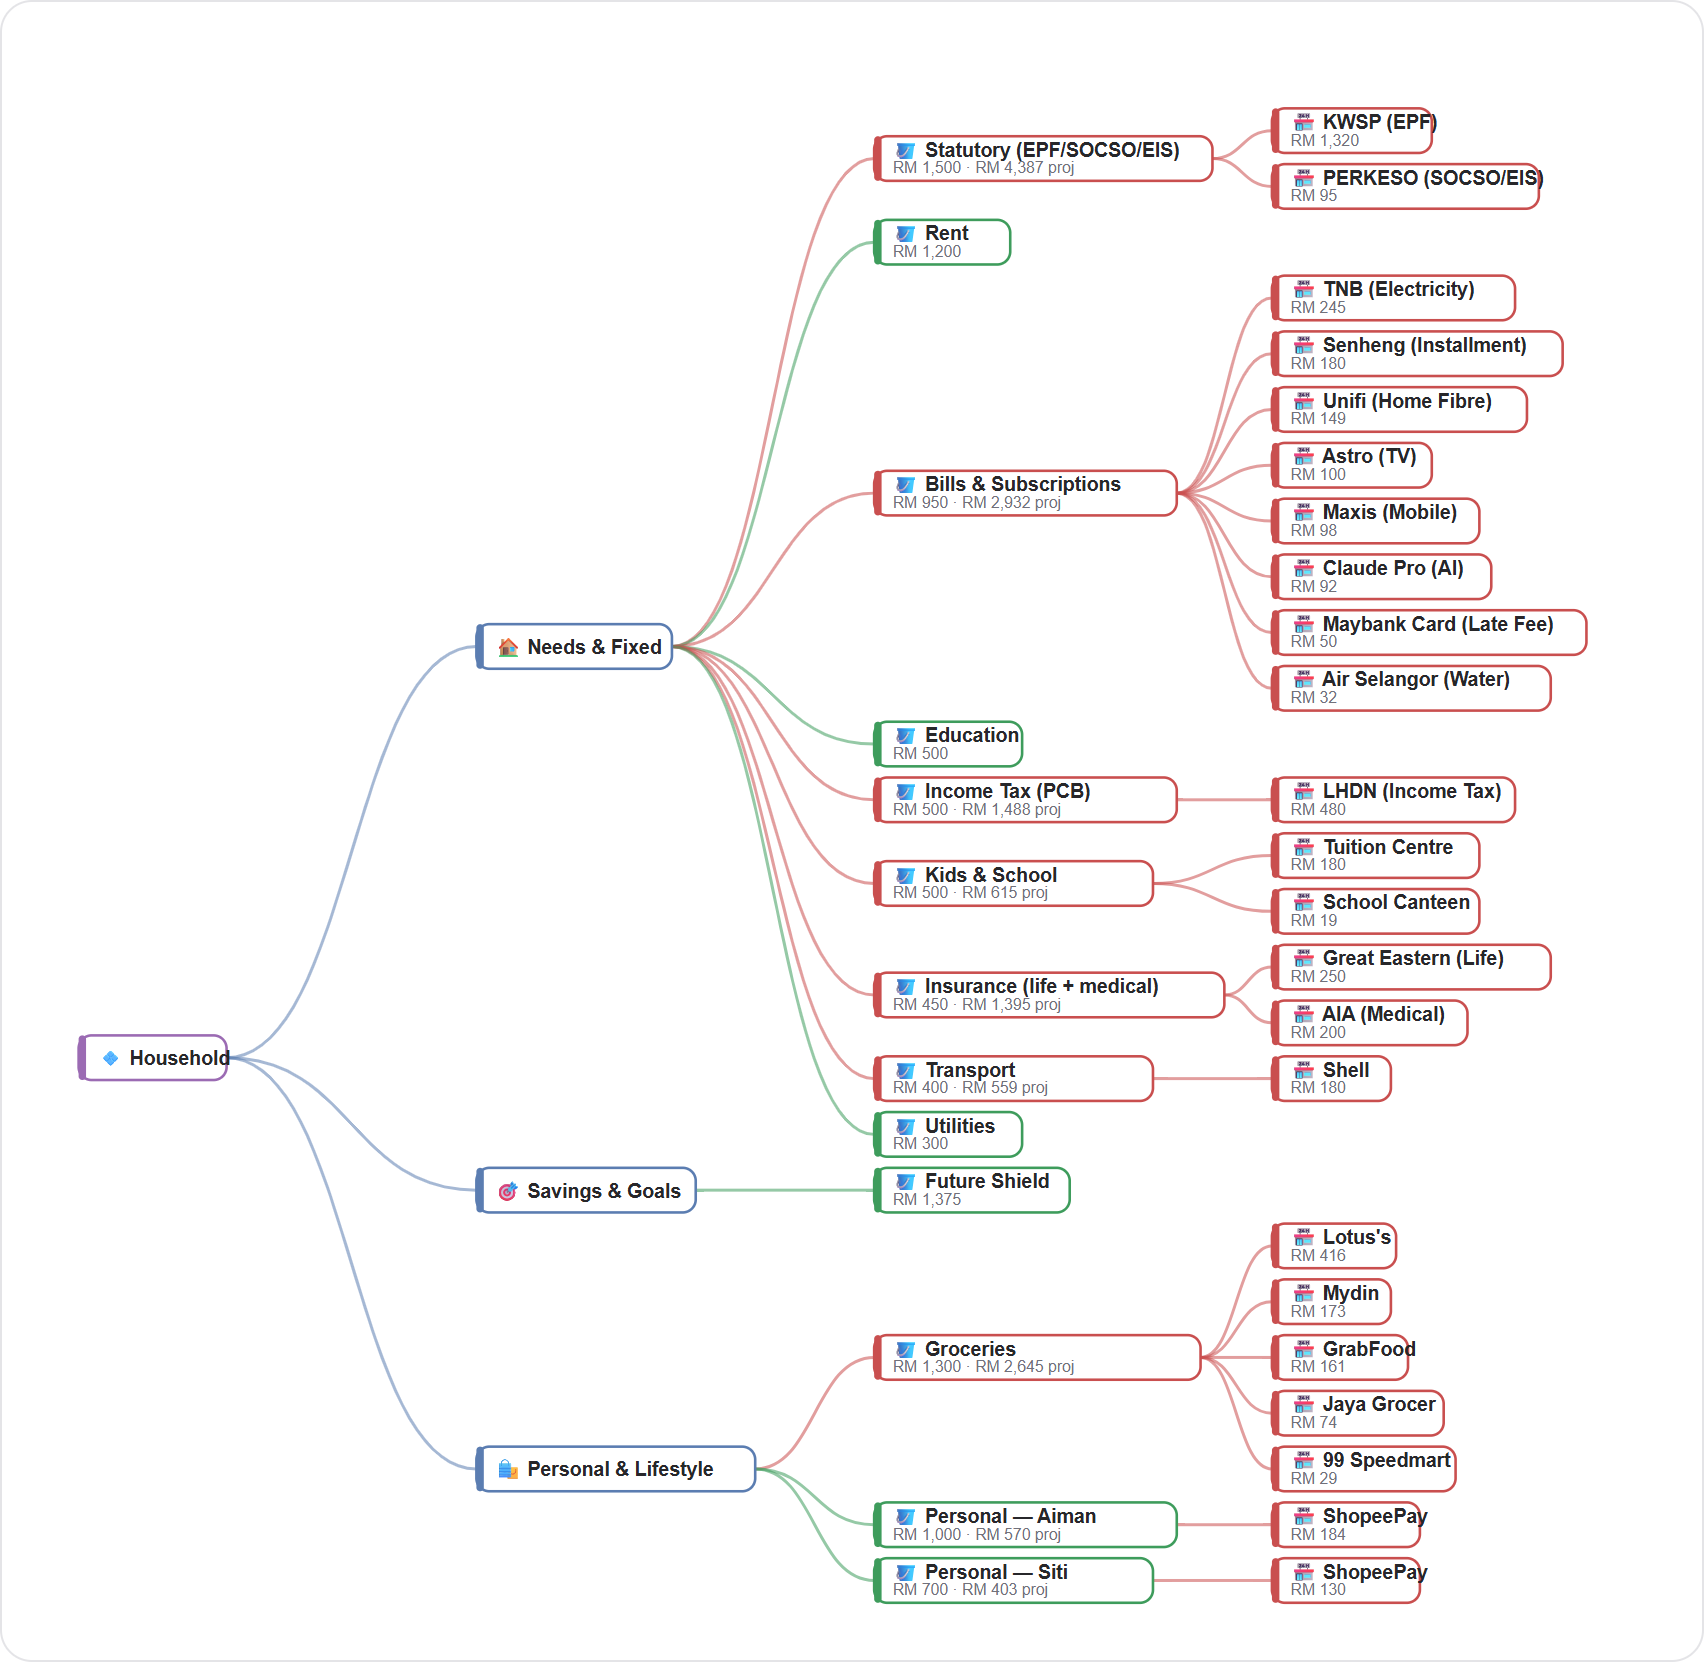
Tree — trace a cost to its source
The budget as a branching hierarchy: spending tier → bucket → vendor. Answers "what sits under Groceries?" — the lineage view.
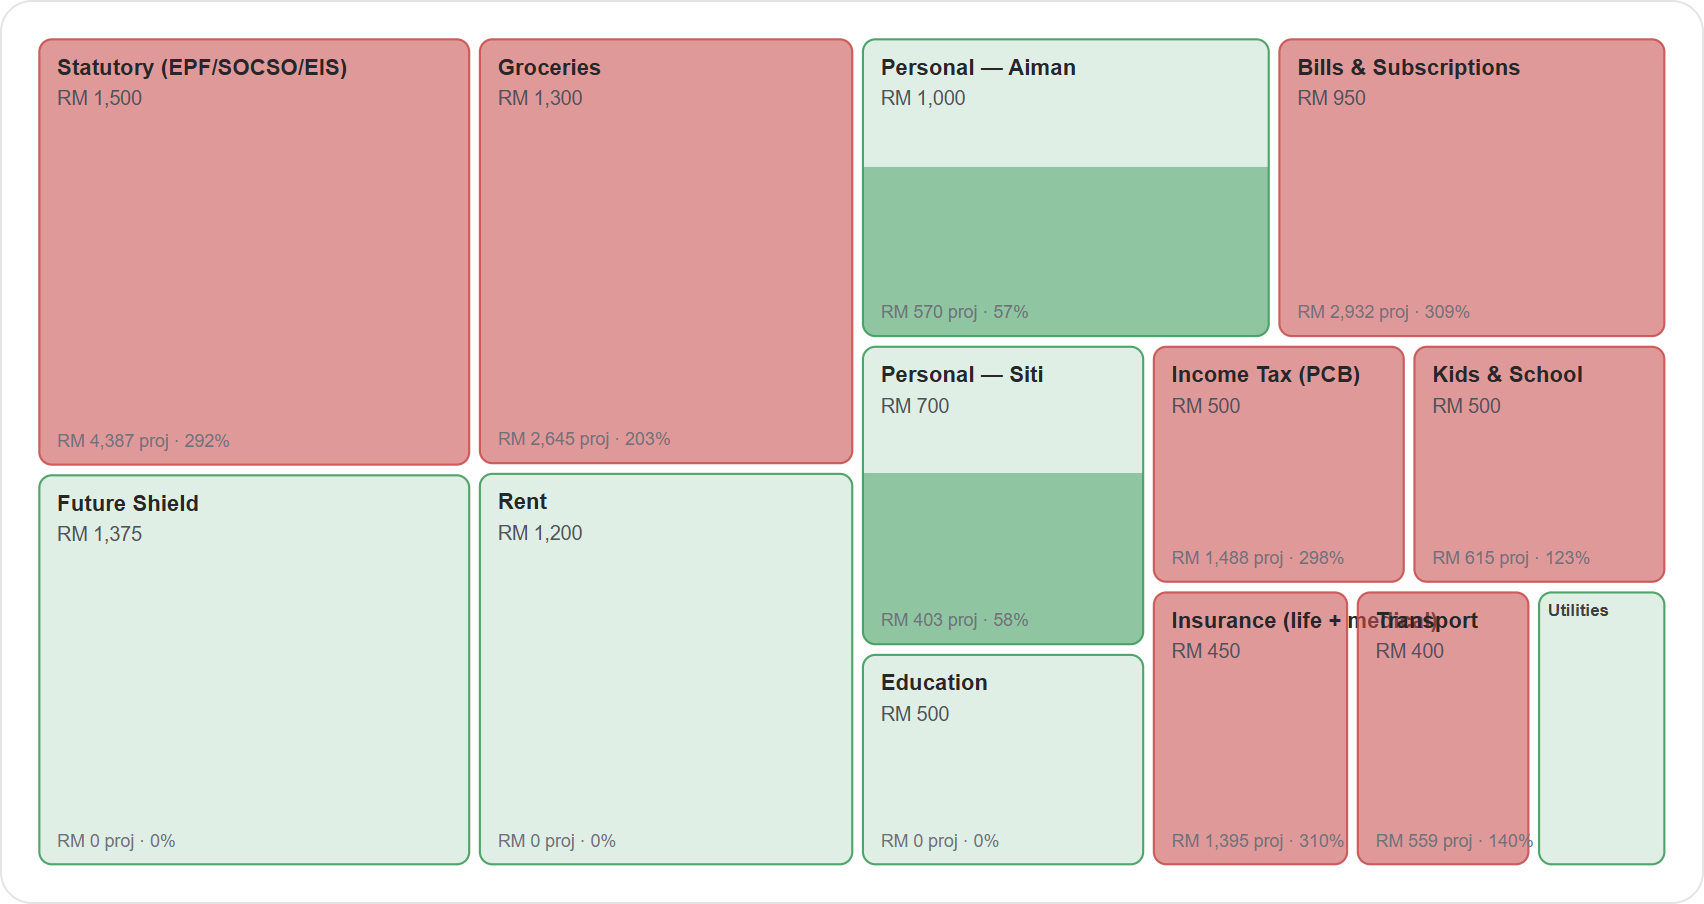
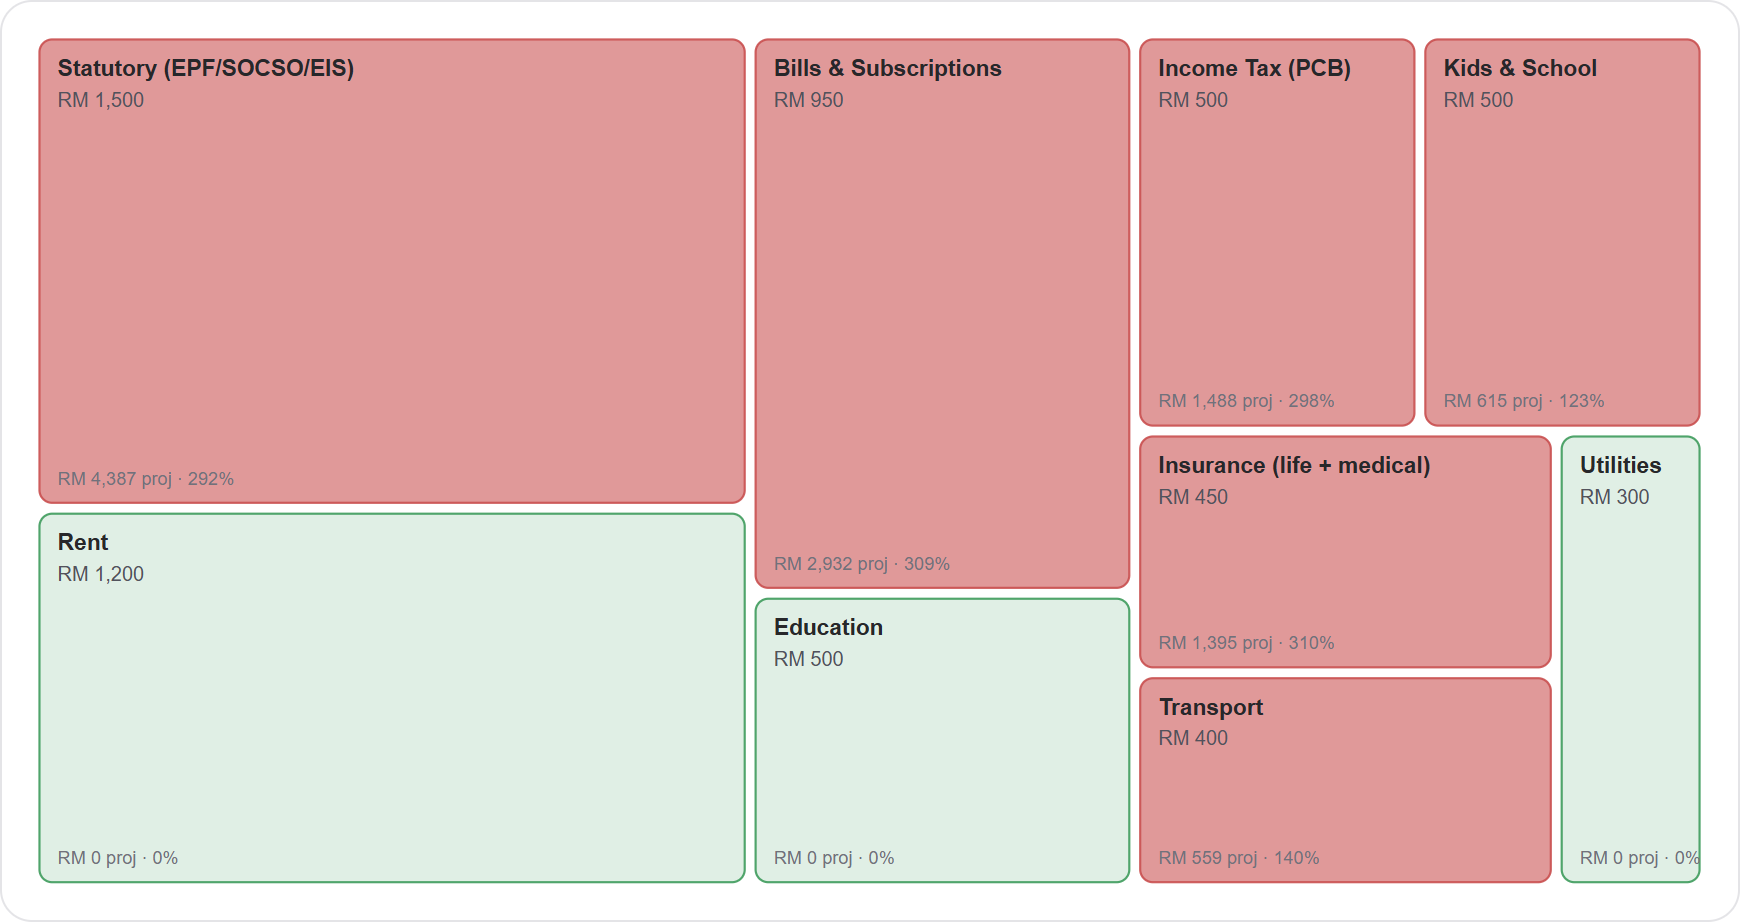
Treemap — what's my budget made of, and what's over?
Cell area ∝ monthly allocation; colour ∝ status (green on-track → red over budget); the solid fill rises with projected spend. Best for spotting an over-committed budget at a glance.
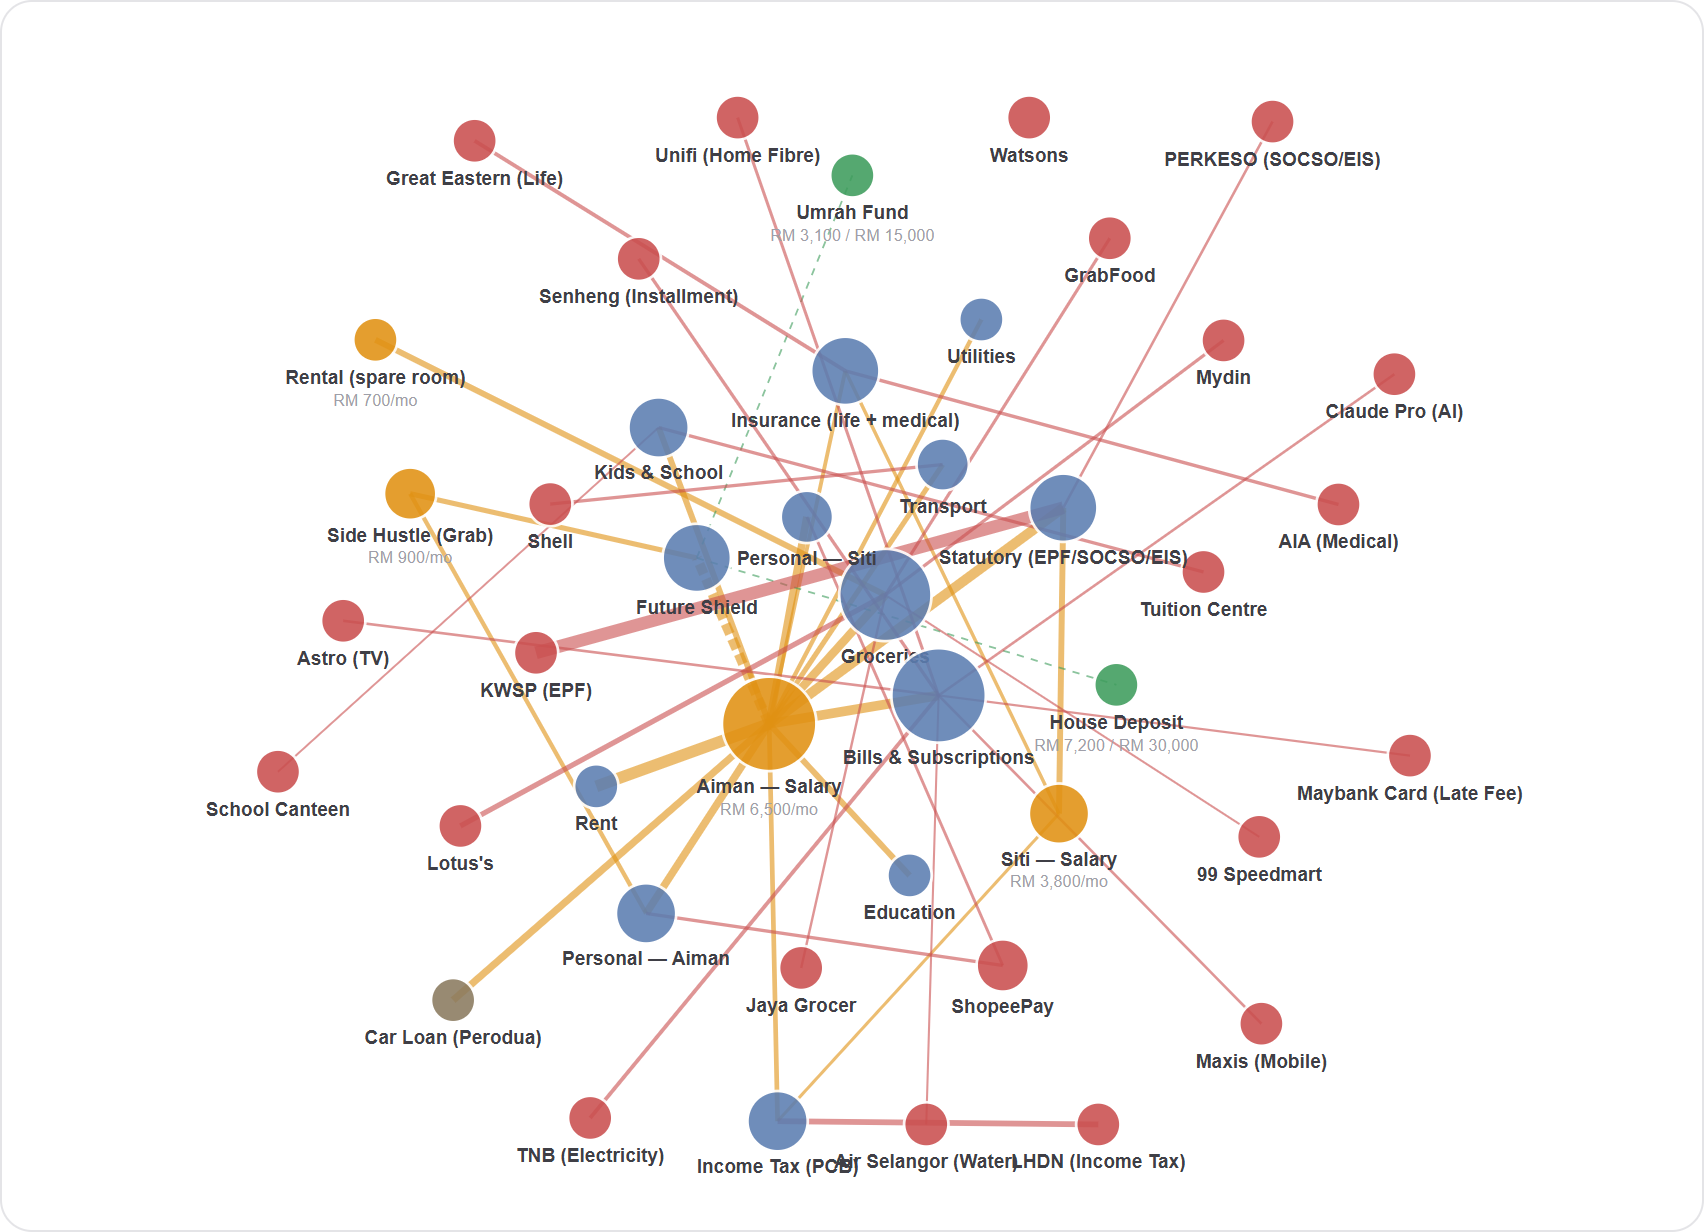
Organic — the raw knowledge graph
The force-relaxed graph itself. Node size ∝ number of connections; amber = income, blue = buckets, green = goals, red = vendors. The "there really is a graph under here" proof.
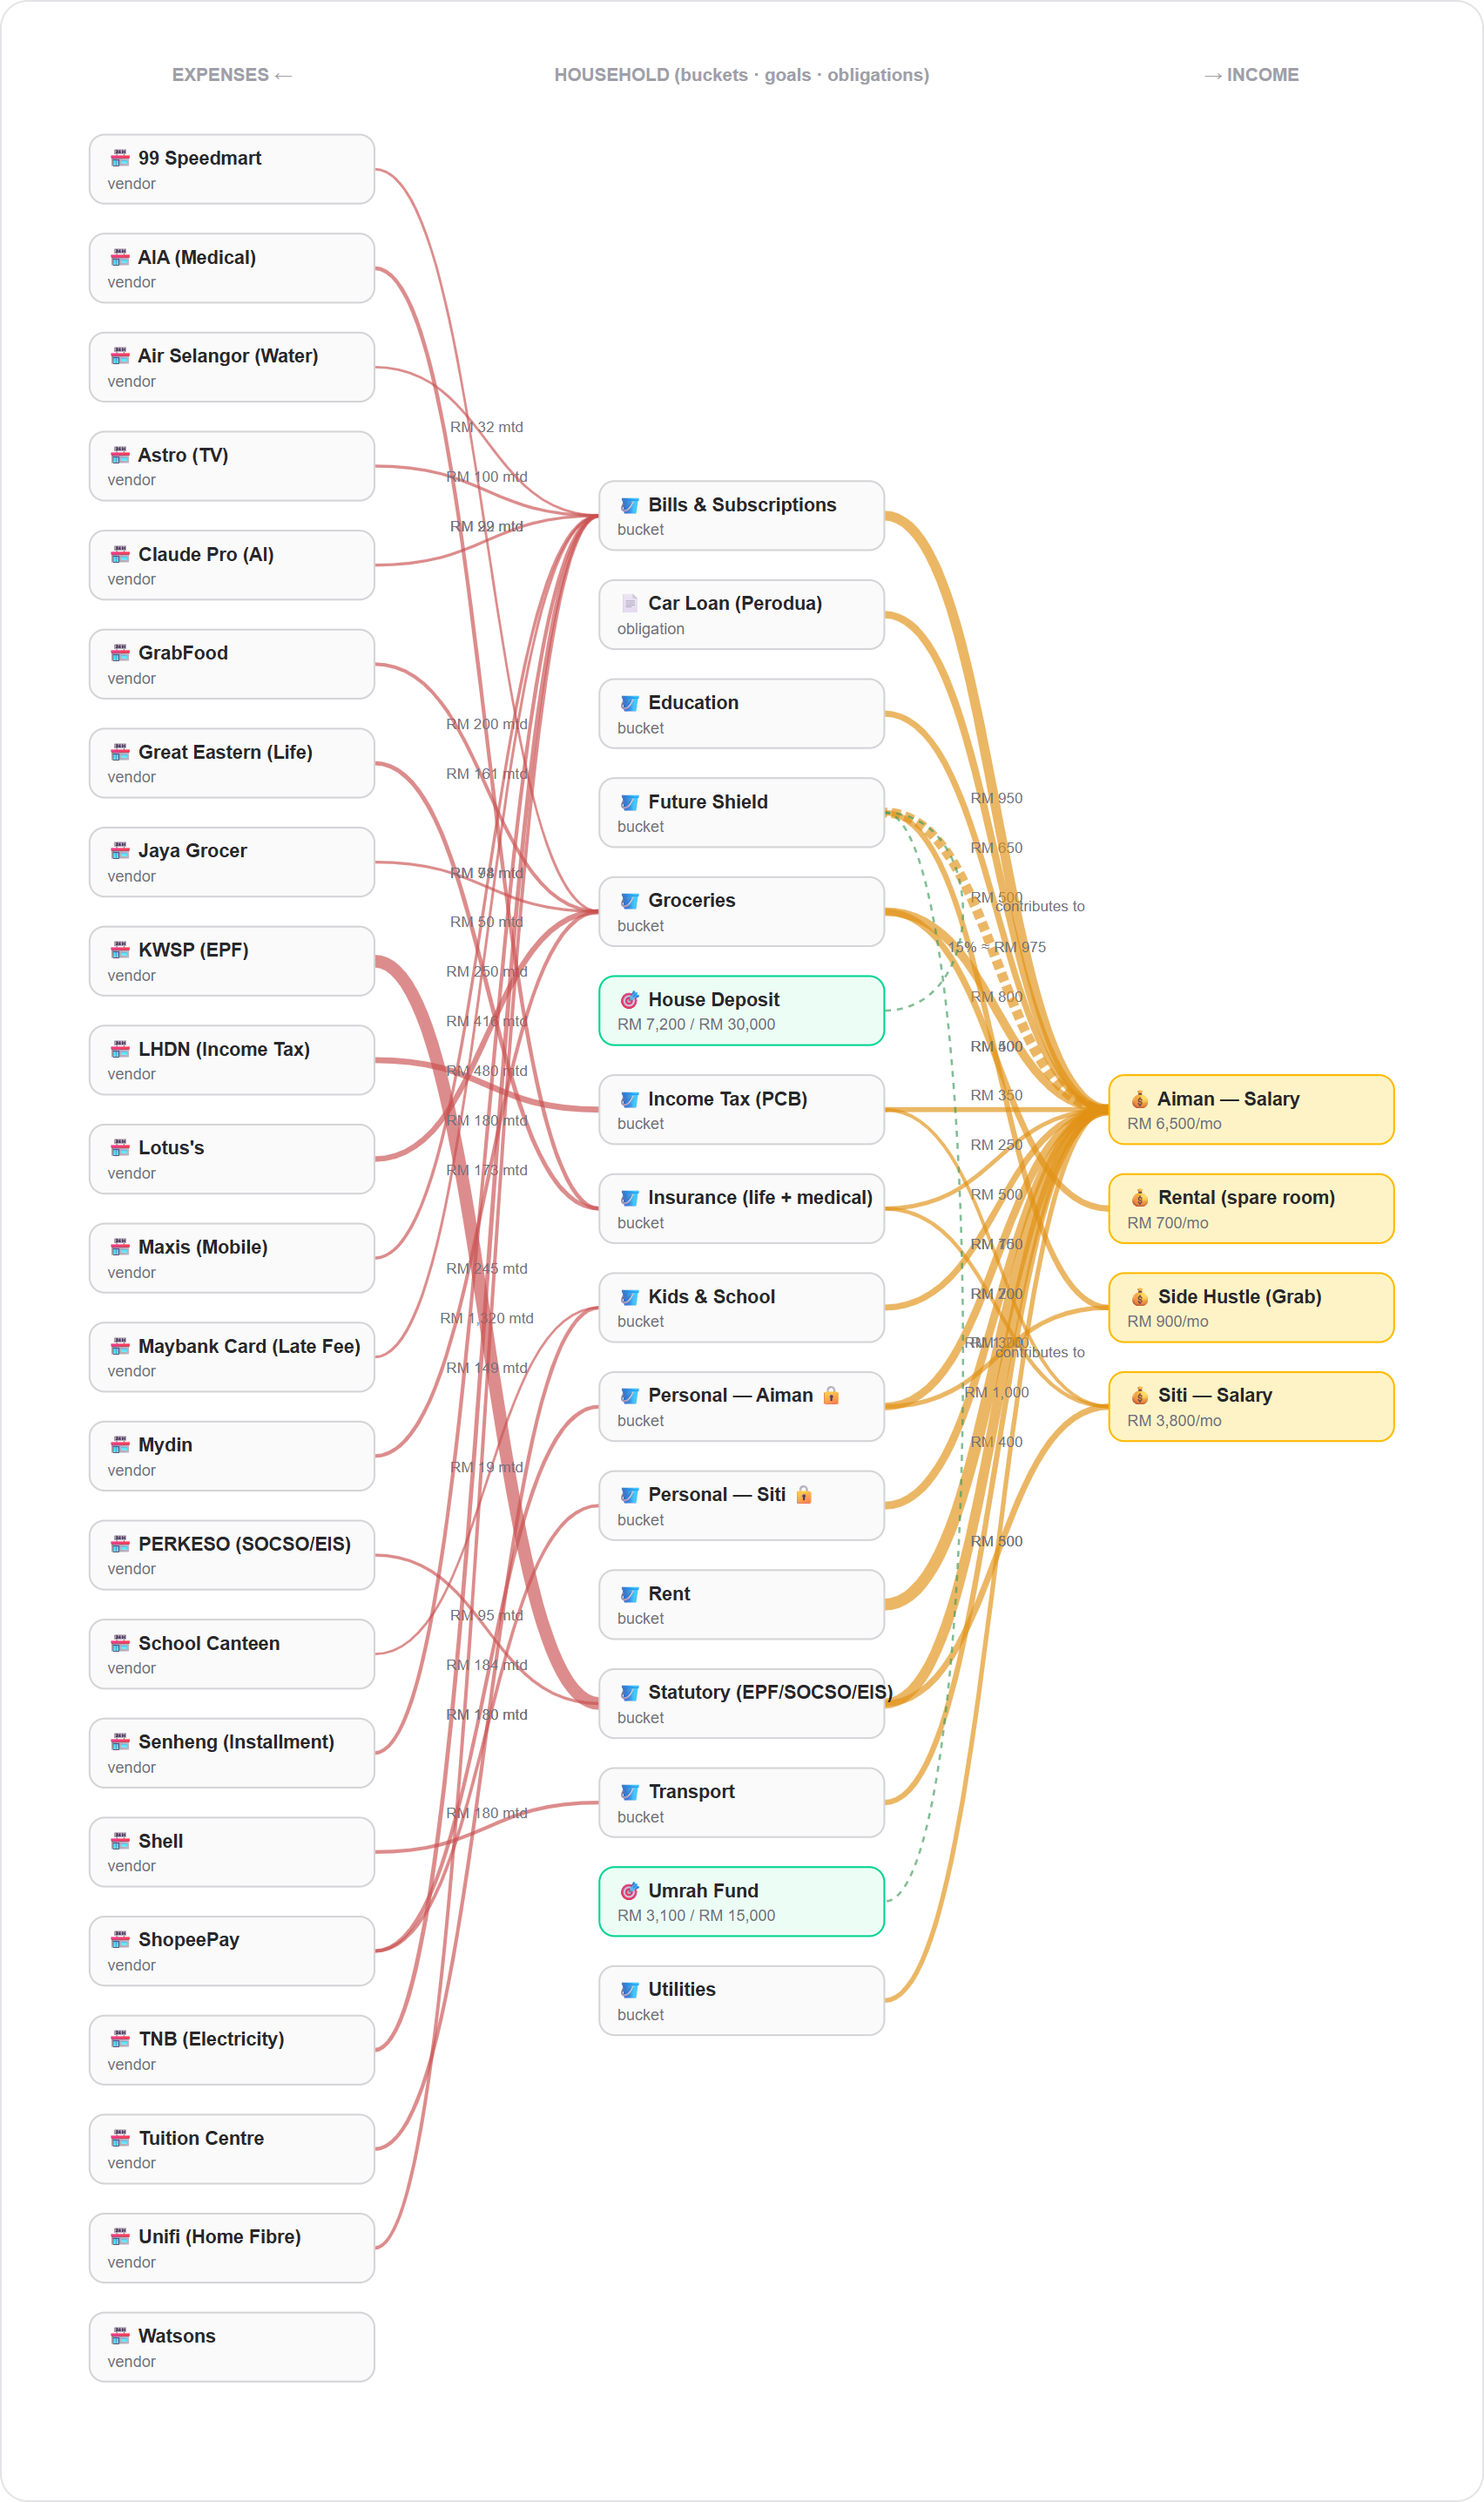
Flow — the classic branch view
Expenses on the left, household structure (buckets · goals · obligations) in the middle, income on the right — money reads right → left.
Any node is a lens
Pick any person, income stream, bucket, vendor or category and the whole page re-renders through that lens — KPIs, graph and captions all refilter.
People lens — one person's money
Focus on a single household member: their spend, their envelopes, their vendors — without exposing anyone else. This is also the marital-safe boundary: private wallets stay private.

Vendor lens — one merchant's lineage
Focus on a single vendor to see which bucket it draws from and how much — useful for "where is this shop eating my budget?"
Category lens — one spending tier
Focus on a category tier (here essentials / Tier 1) to isolate non-negotiables from lifestyle and savings.
One engine, three sizes of household
Individual → couple → family. The same graph model, the same three buckets, no schema change — one product that grows with the household instead of three that don't talk to each other.
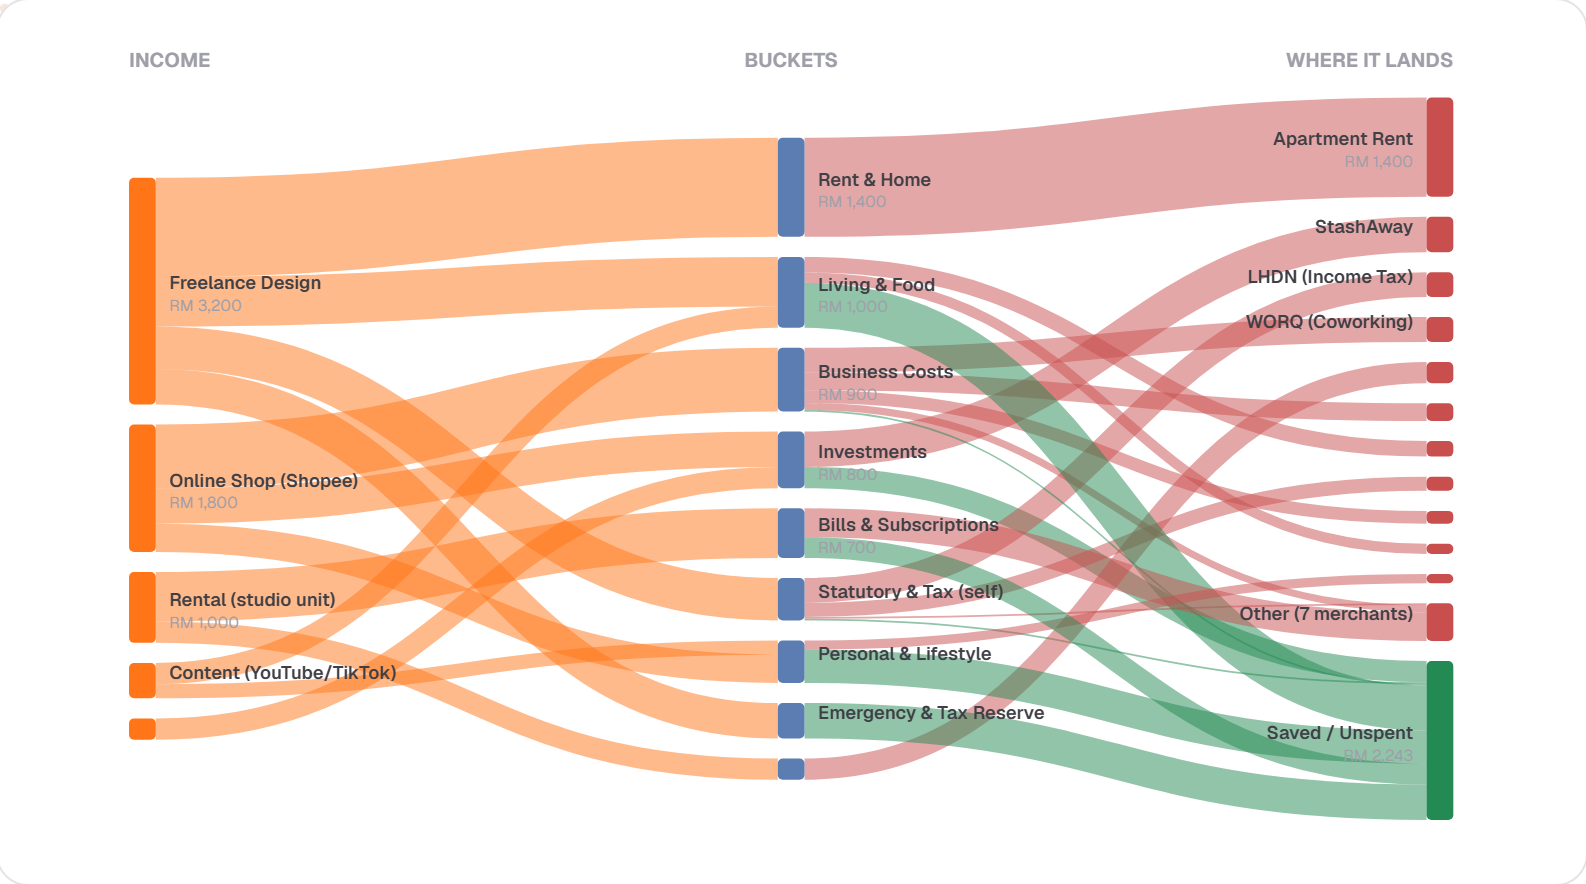
Individual — a multi-stream freelancer
A household of one with five income streams — freelance design, an online shop, a rented studio, dividends and content — flowing into living costs, reserves and investments. Proof the model handles gig and irregular-income realities.
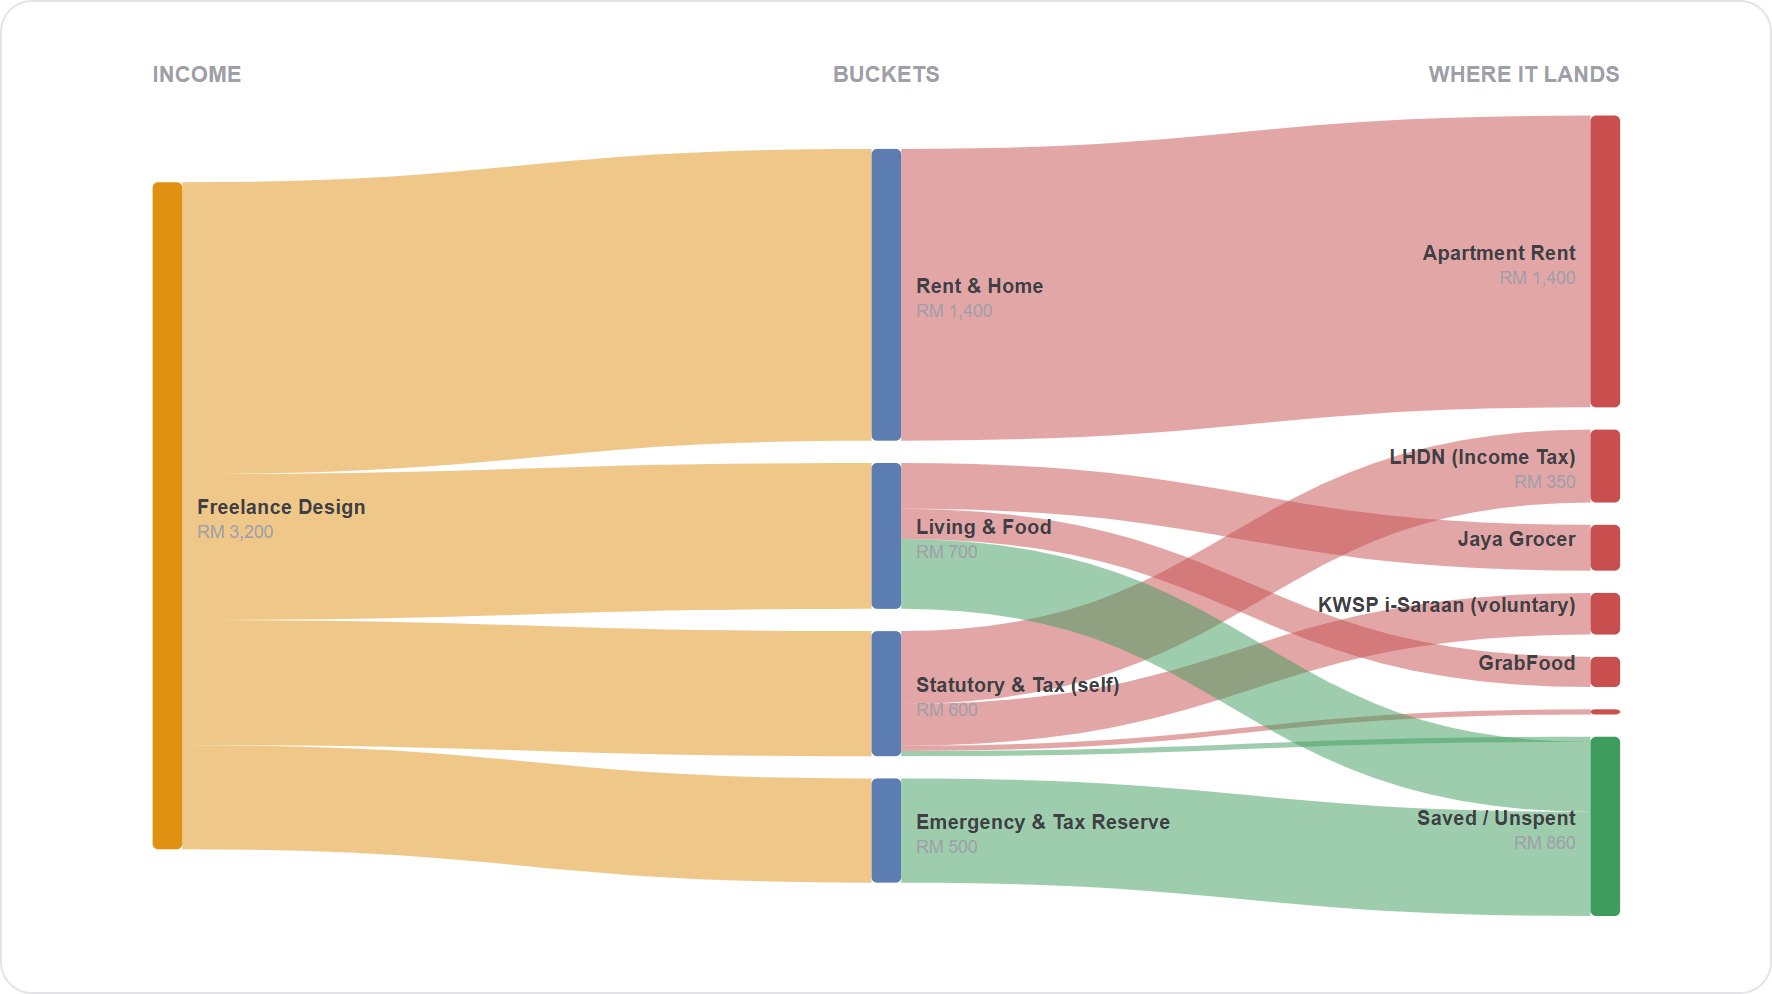
Income lens on the freelancer
Isolate a single revenue stream to see exactly what it funds.
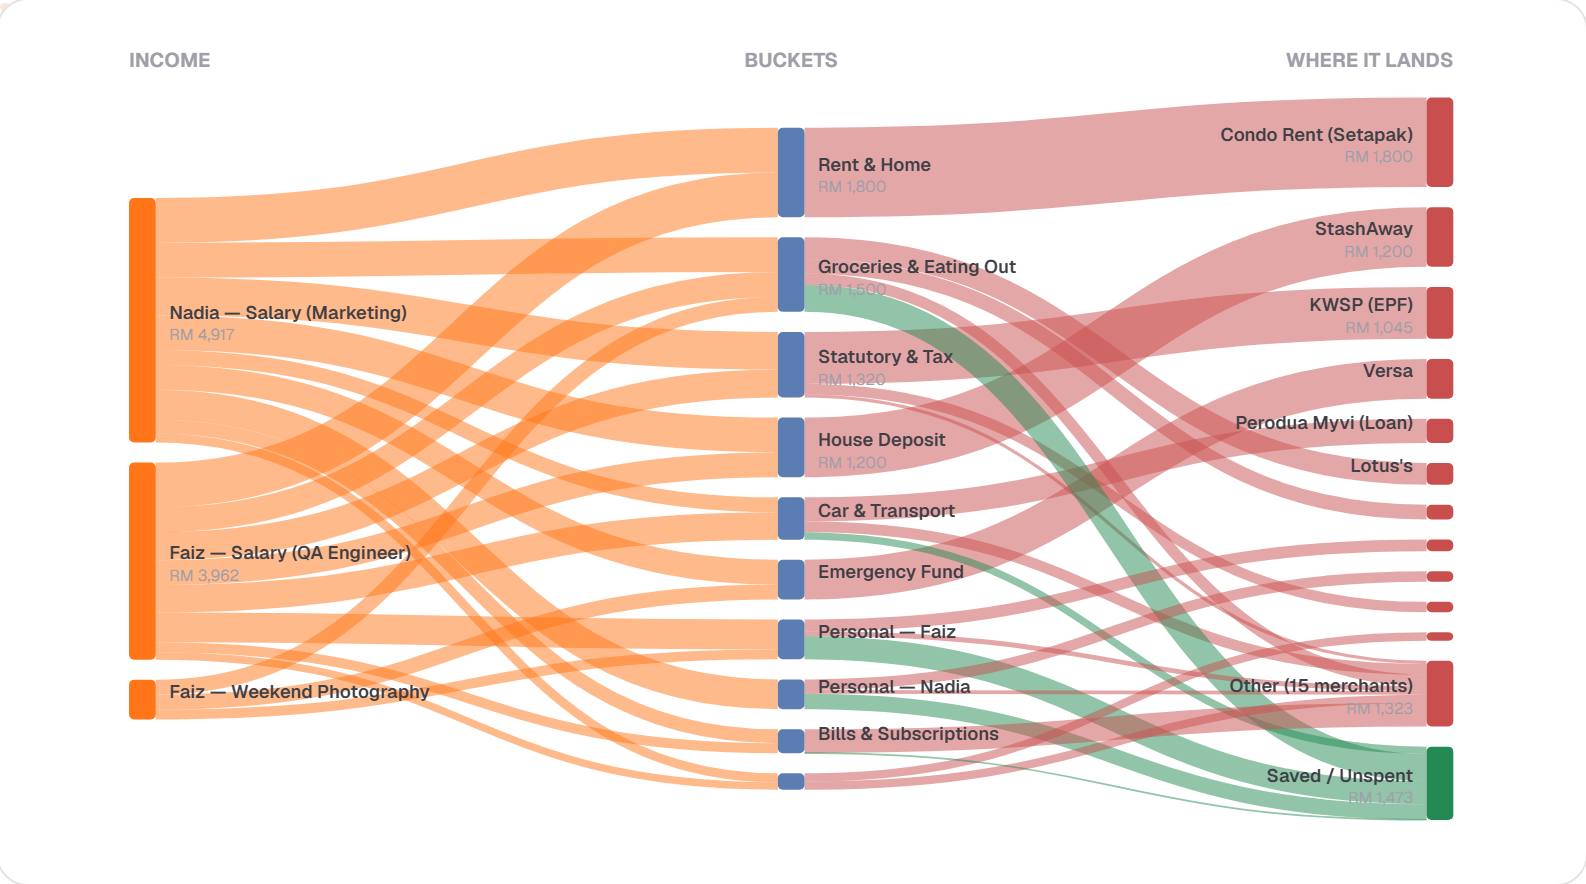
Couple — two incomes, one set of obligations
Both salaries fan into the same shared must-paid buckets, and each partner funds a personal bucket of their own. Funding transparency where it helps, spending autonomy where it doesn't — the split that keeps money out of the argument.
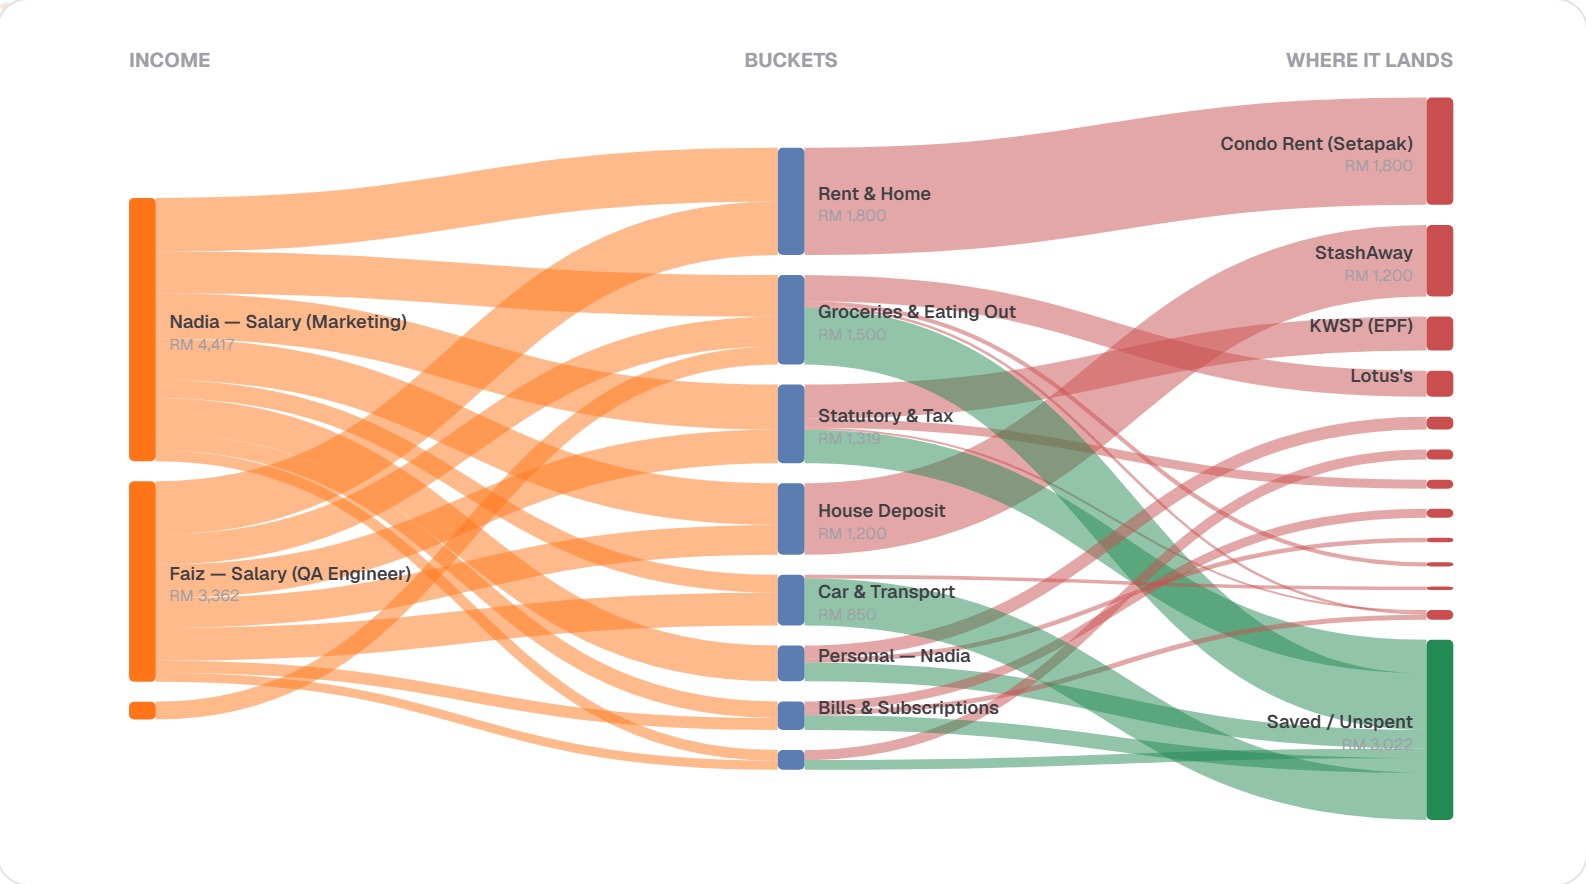
People lens on the couple
Focus one partner to see what they fund and what they spend. The other partner's personal bucket keeps its total and loses its line items — privacy enforced by the graph, not by a promise.
Captured from the running app over the seeded demo data. The graph page is fully URL-driven (mode = sankey · treemap · tree · organic · bars · flow; focus = a member, node or tier), so every view above is a shareable link.